How it works
Six apps, one page. Each tab covers what the product does, who needs it, real screens from the app itself, and the ten questions people actually ask.
Reflections · Decision quality
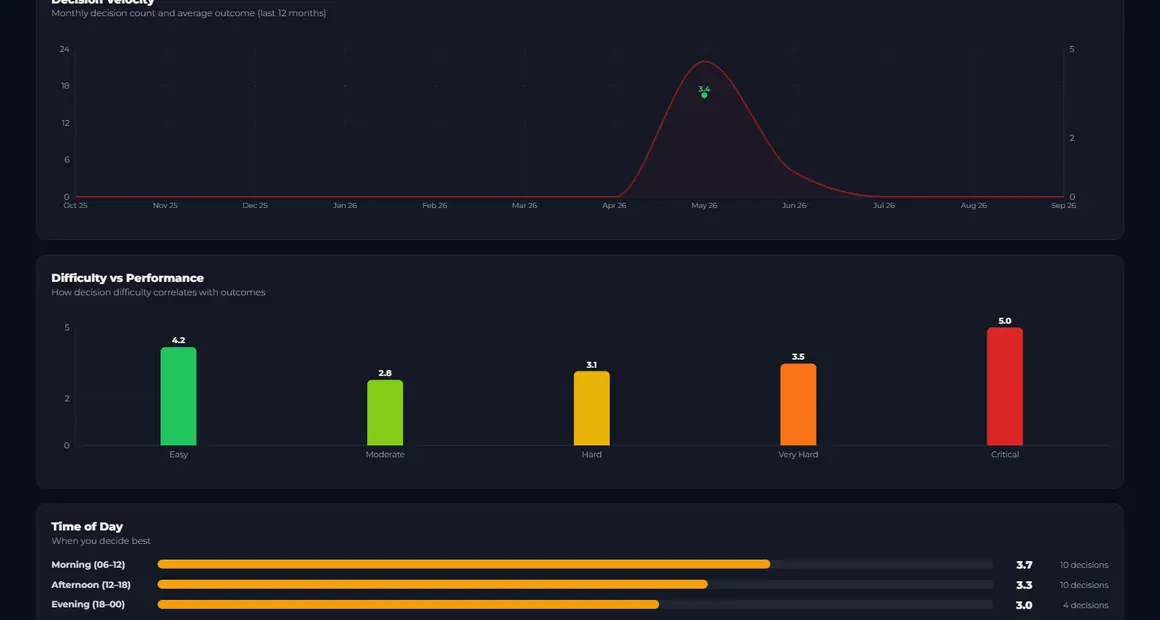
It records your decisions with the conditions you made them under, then re-scores the same decision as the outcome appears. Within a few months the conditions behind your best and worst calls become measurable.
For managers at any level who want to measure and improve how they decide.
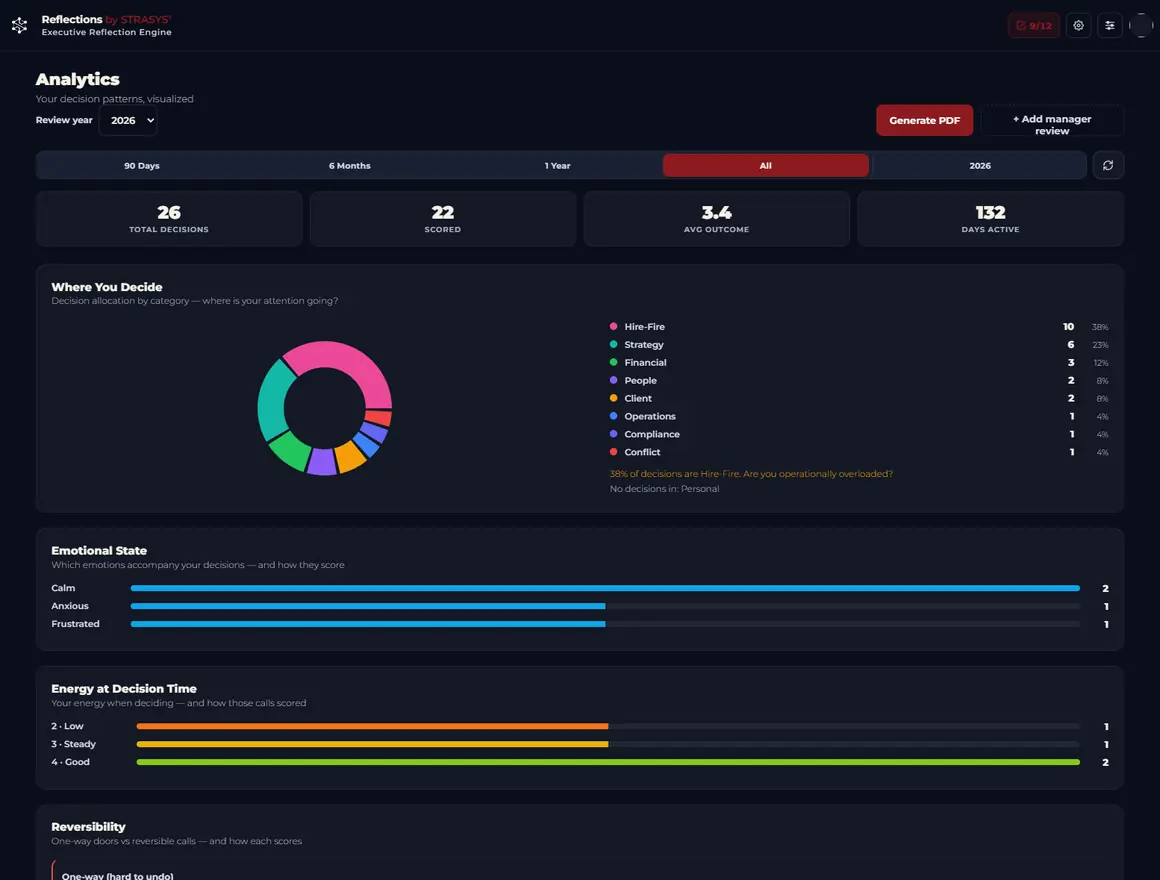
Screens from the app
Frequently asked
01How do I improve my decision making?
You record the conditions of the moment you decided: difficulty, dominant emotion, stress, energy, confidence, time of day, and whether the decision was reversible. You then re-score the same decision the next day and over the following months against what actually happened. The pattern that builds up shows where your best and worst calls come from, and once you can see it you can change it.
02Does recording take time, do I fill in a form?
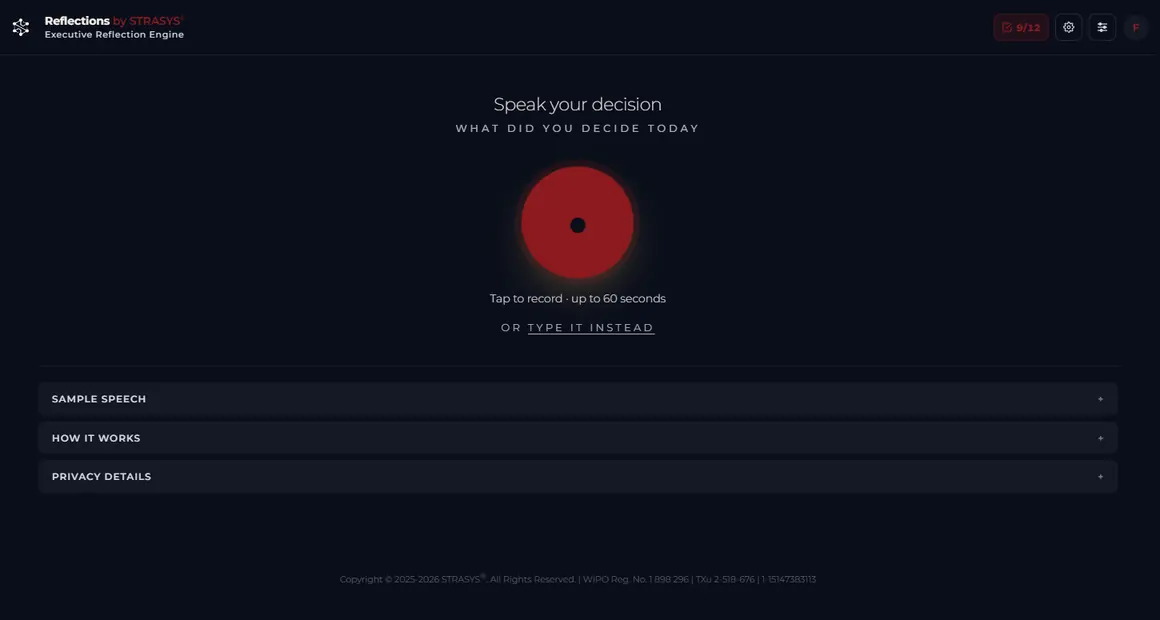
No. You describe the decision in a 60-second voice note and 13 fields are filled for you; anything unclear is left empty, never invented. If you prefer typing, written entries are unlimited on every tier.
03Does stress make my decisions worse?
The app answers this from your own data: it shows your average outcome at each stress level and states how many points high-stress decisions run below (or above) low-stress ones. The same cut exists for energy, time of day and emotion.
04How do I know whether a decision was right?
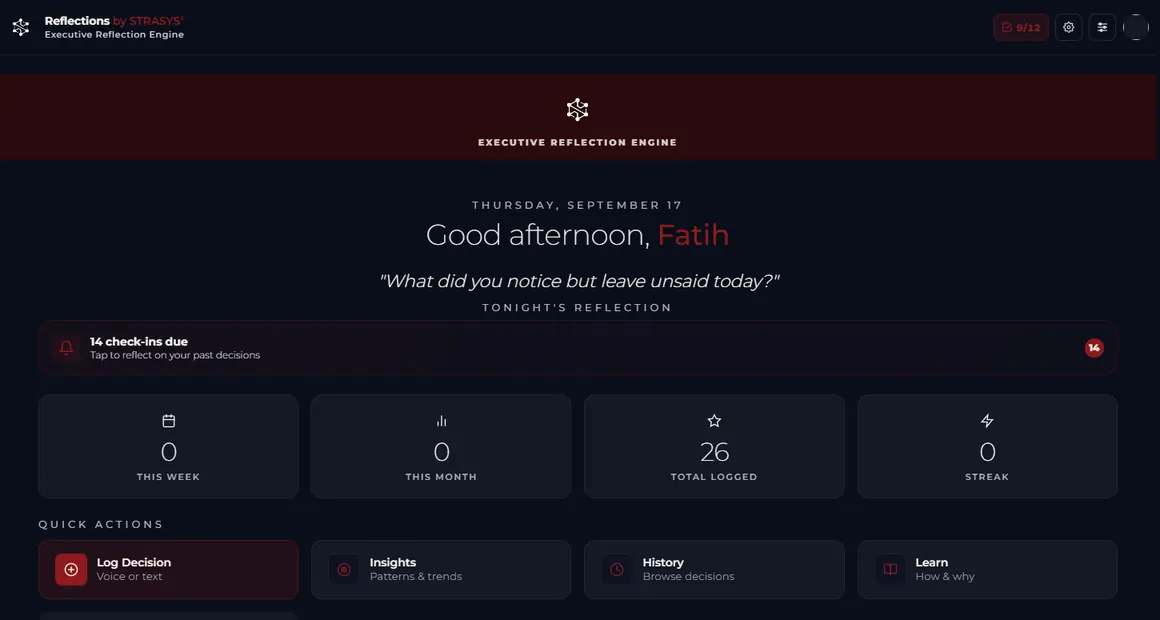
Every saved decision gets a review ladder: on the free tier the next day, month 6 and month 12; on Executive the next day and every month for a year. When one falls due you re-score the decision 1 to 5; the next-day score is one tap on the home screen.
05How is the score computed, does the first impression dominate?
No, the opposite. The score is a weighted average of the check-ins and later ones weigh more: the next day counts 1, month 12 counts 13. A judgement made months later carries less rationalisation than one made the morning after.
06Is my confidence calibrated, or am I fooling myself?
The calibration section compares the confidence you felt with what actually happened and places you in one of three directions: over-confident, calibrated, under-confident. A separate "next-day drift" figure tells you how far your first reaction sits from your later judgements.
07Can I edit a decision afterwards?
No, by design. A saved decision is immutable; the database rule refuses updates outright. You can delete one, but only with a written reason, and the deletion lands in a separate audit record that is itself immutable. The point is that the moment of the decision cannot be tidied up later.
08Do I get written reports?
Four periodic reports: biweekly (10 decisions minimum), quarterly (25), half-yearly (50), annual (100). Each is written against the previous period of the same type, and the comparison rests on data handed to the model, not on its memory. Executive adds two on-demand reports a month.
09Is my voice stored, and who sees my decisions?
Audio is never stored: it travels inside the request, the fields are extracted and it is dropped; file storage is closed entirely. Nobody but you sees the decisions; there is no sharing, team, invite, comment or role, and every database path is locked to its owner. Sign-in is Google or Microsoft, with no password.
10What does it cost, and can I get my data out?
The free tier is permanent: unlimited written decisions, 3 voice captures a month, a 3-step ladder, 4 short reports a year. Executive is $6.99 a month or $53.99 a year, with a 30-day trial and no card. Your data exports as a single JSON file and account deletion sits inside the app.
Execution · Strategy execution
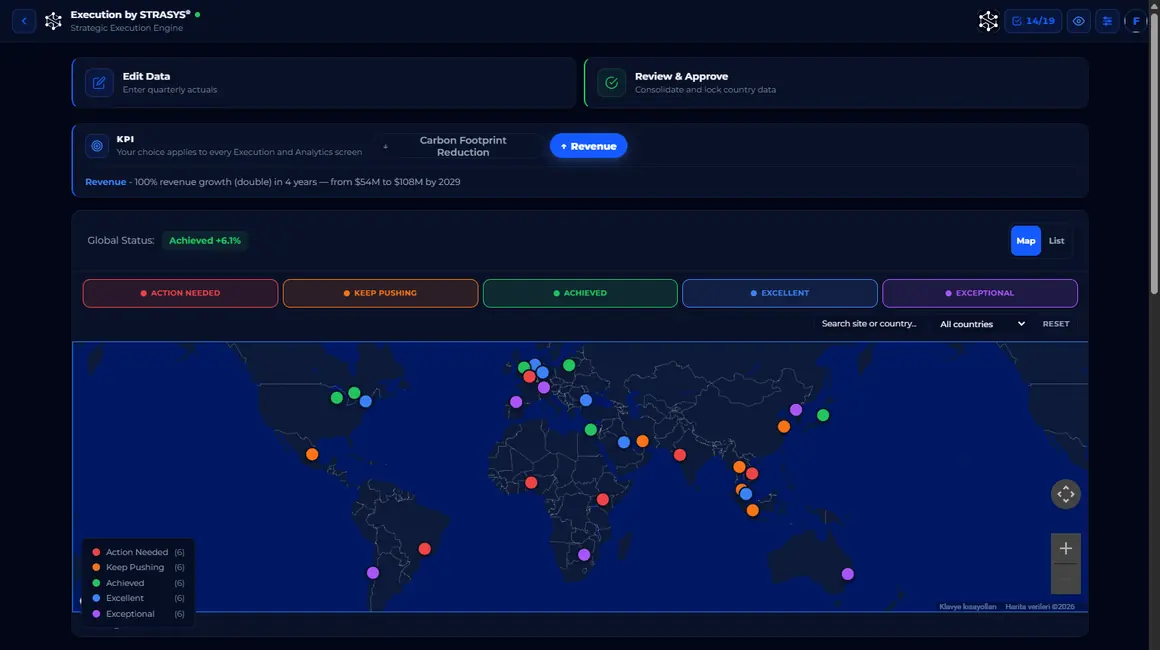
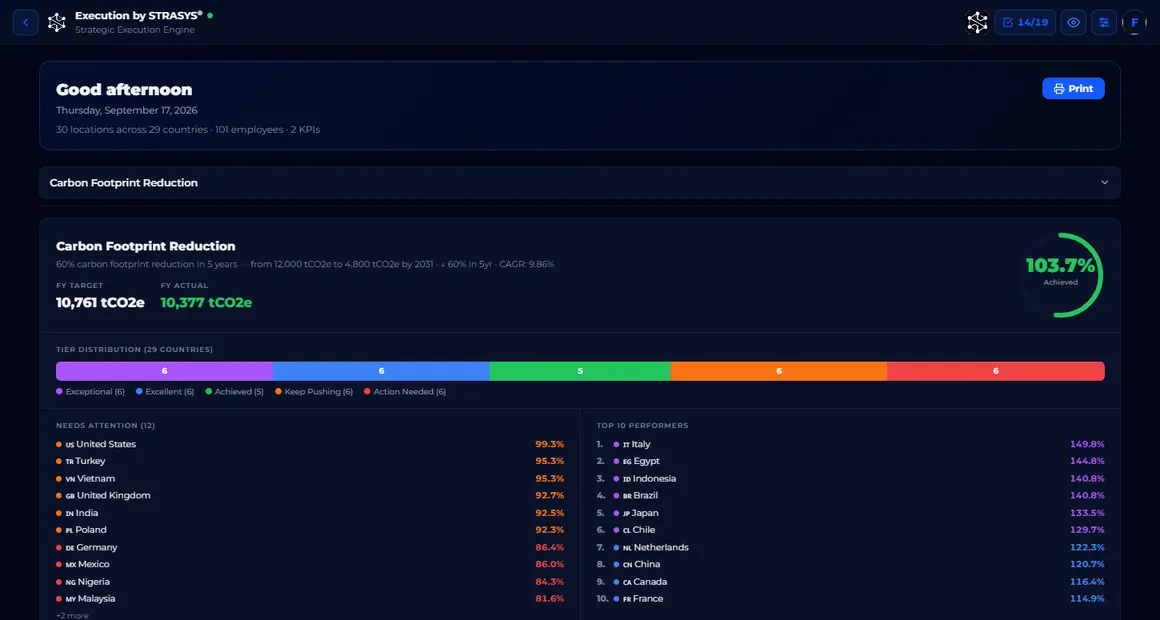
It pushes a strategic target down to region, country and site, then collects, approves and locks the quarterly actuals. At year end the record speaks, not the argument.
For multi-site companies that must push a target to the floor and collect the actuals in one record.
Screens from the app
Frequently asked
01How do I cascade targets from the CEO to the field?
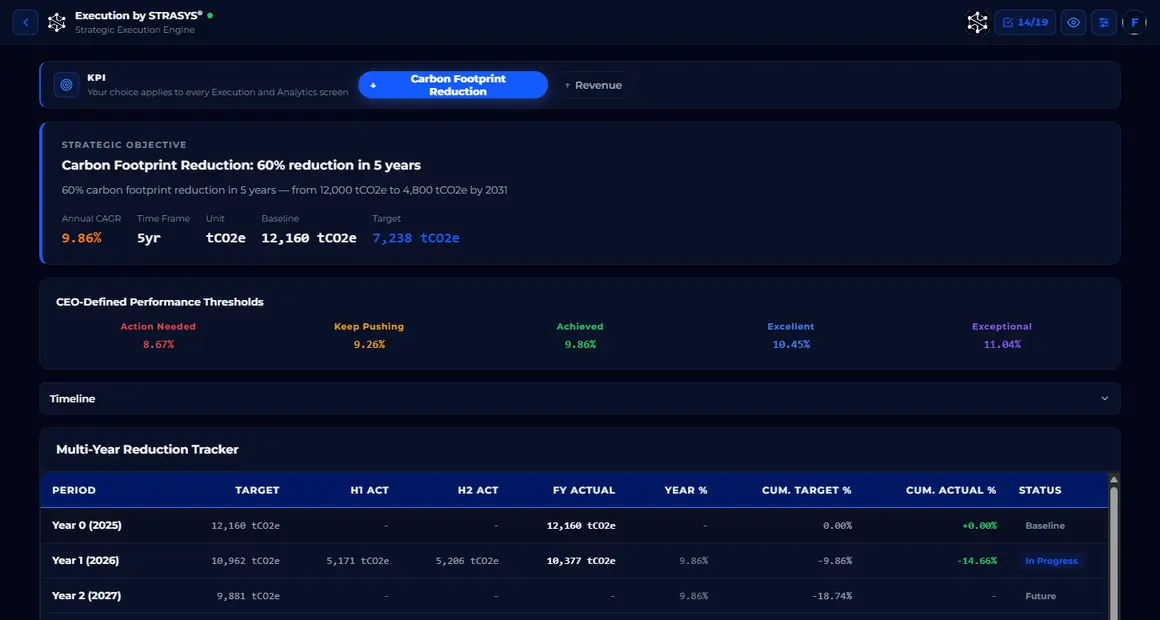
You enter one cumulative commitment at the top: "100% growth in four years". The app converts it into the required annual rate with CAGR and ties it to every location's quarter across four geographic levels. Quarterly targets cannot be typed in; the field is disabled and people enter only last year's figure and the actual.
02Can targets that must go down be measured (carbon, scrap, complaints, cost)?
Yes. A KPI is set as growth or reduction; for reduction the multiplier inverts and performance is computed as target over actual. One detail matters: a zero result is never confused with "nothing entered". If the reporting stamp exists, zero is a perfect score; without the stamp it is zero.
03Once I enter a multi-year target, are the calculations automatic?
Yes, there is no manual arithmetic. The annual rate, quarterly targets, half-year and full-year roll-ups, direction-aware performance and a five-band score are all produced automatically. The spreadsheet that used to hold the target table disappears.
04How do year-end close, corrections and revisions work?
Periods lock at half-year; at year-end the year is sealed, archived and carried forward. Locked data cannot be changed by hand; a correction goes through the approval flow and every change is written to the audit trail. Past years are read from the Year History screen.
05Are there country-level target revisions and approvals?
Yes. Data ownership and approval are two separate layers: figures entered at country level pass through an approval flow, and country target revisions are reflected in the evaluation screen. Scope is derived from role: tiers 1-2 global, tier 3 regional, tiers 4-6 country.
06Will we hit the target, can I see it today?
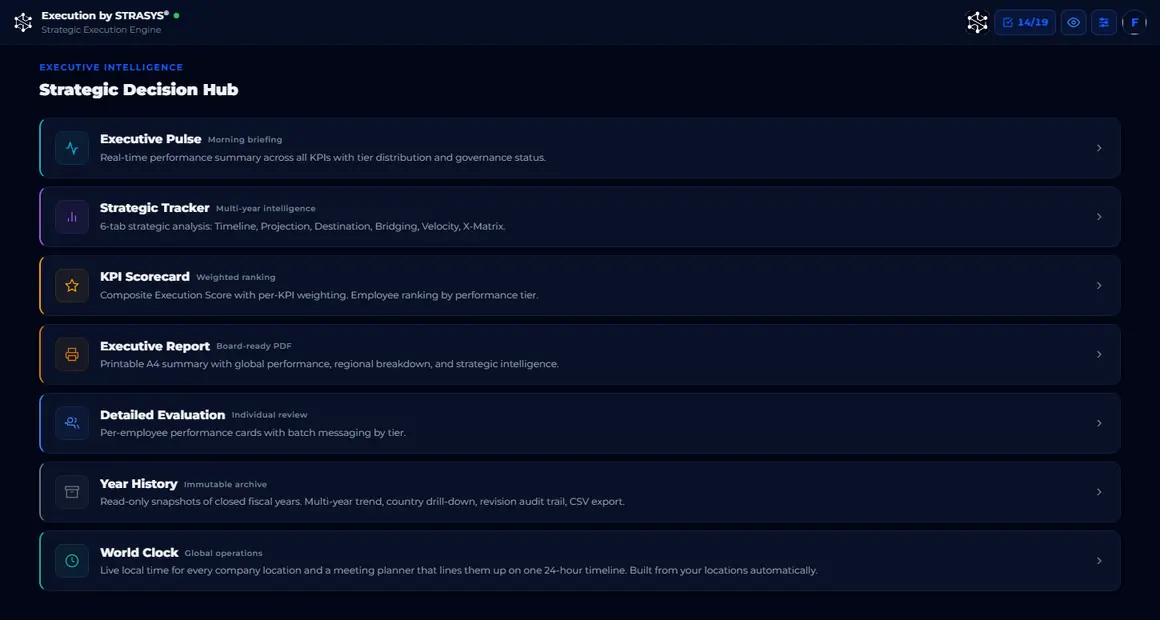
The Strategic Tracker's projection and destination views compute where the year lands at today's pace, and an AHEAD/BEHIND indicator gives the gap at a glance. Six views show the same data from different angles: timeline, projection, destination, bridging, velocity and X-Matrix.
07What is a Hoshin Kanri X-Matrix, and do I have to fill it in separately?
The X-Matrix is the classic Hoshin tool that ties annual objectives, breakthroughs, measures and owners together on one page. In Execution you do not fill in a separate sheet: the matrix is built from the targets, KPIs and locations you already entered, and it is one view of the Strategic Tracker.
08Where are we strong and weak geographically?
On a performance-coloured map, broken down by super region, country and location. The geographic hierarchy covers 245 countries across four levels, and the number of locations is unlimited.
09Who sees what?
Six tiers and eight roles: Super Admin, Admin, CEO, C-Suite, EVP, VP, Director, Manager. The permission table is 8 roles by 23 rows and scope is derived in code. The Settings tab renders only for CEO and admin; everyone else sees four tabs.
10Price, capacity and data?
Four tiers, monthly only: Starter 10 seats $49, Growth 25 seats $99, Scale 50 seats $179, Professional 100 seats $299. There is no annual plan. A 30-day trial with a 10-seat ceiling during the trial. Up to 20,000 employees; data on Google Cloud in europe-west1.
Leadership · Competency and growth
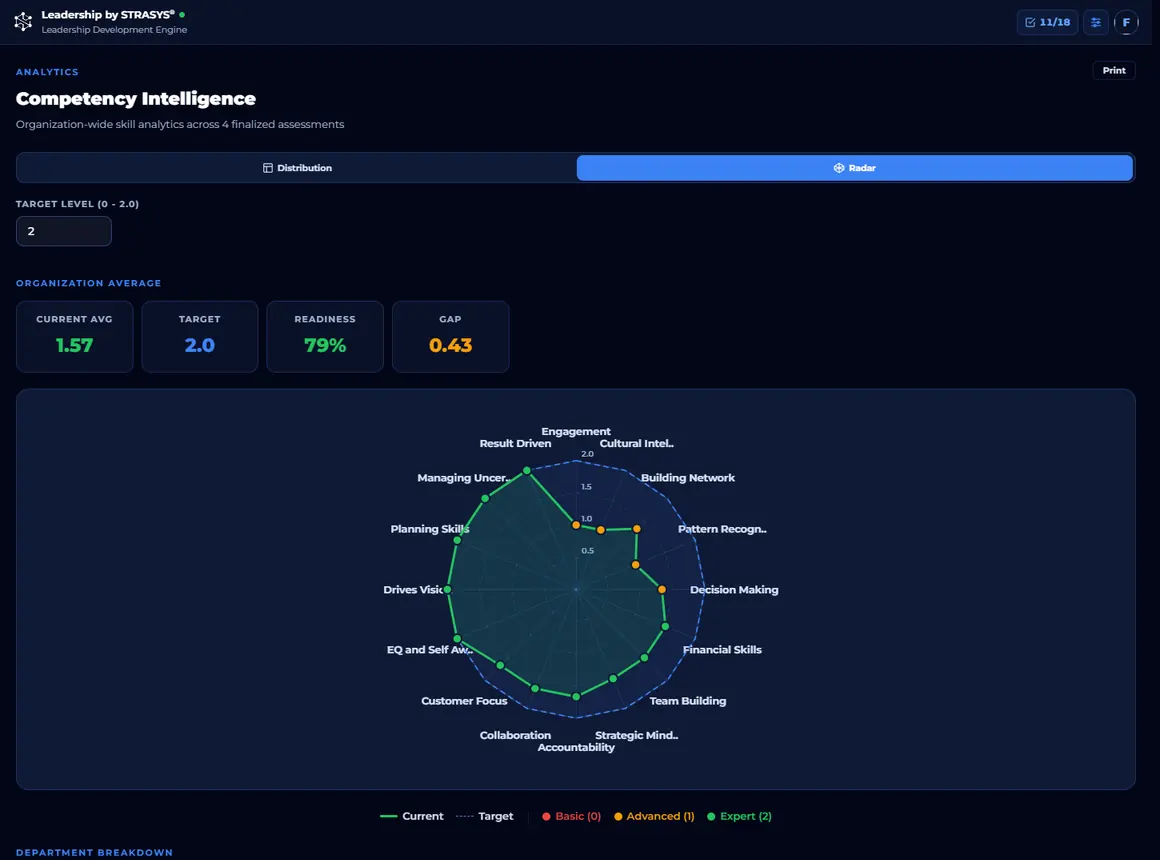
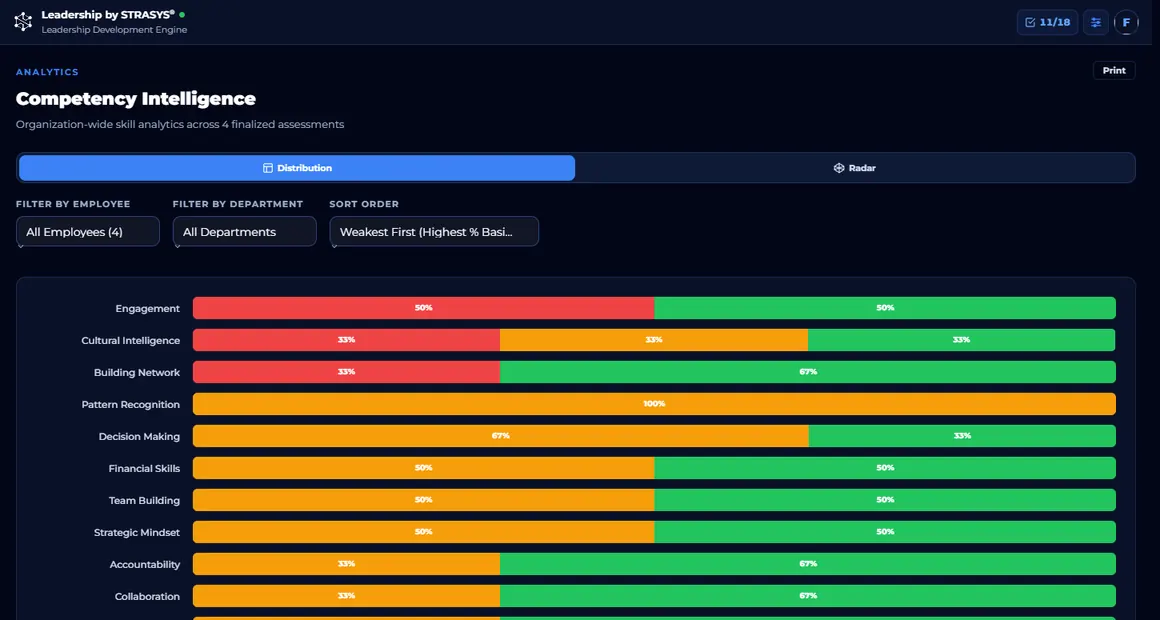
It shows where each person stands on each competency and how far the target is, then turns the gap straight into a training plan. Choosing future leaders becomes a data decision.
For HR and senior management who want to pick their stars and future leaders with evidence.
Screens from the app
Frequently asked
01How do I produce a training plan for my stars and future leaders?
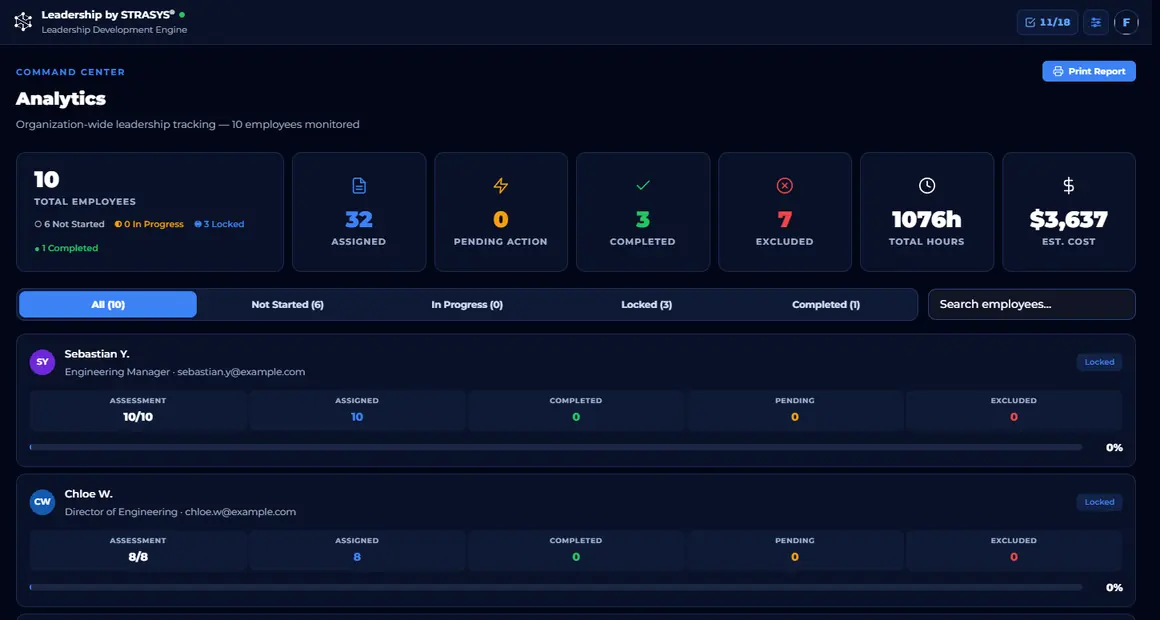
Three steps: competency priorities per job title (Essential, Important, Supportive), an assessment of each person at three levels (Basic, Advanced, Expert), and locking. The moment you lock, a training item is pulled from the catalogue for every gap and a permanent development plan is created; you do not write the plan, the assessment produces it.
02What exactly does the skills matrix give me?
Which competency each job title needs and at what priority, and where every employee stands against it. Organisation-wide distribution, weakest and strongest competencies, filtering by designation and a radar comparison between people all come from the same data.
03How is the readiness score calculated?
Expert counts 2, Advanced 1, Basic and unrated 0. The target depends on priority: Essential 2.0, Important 1.5, Supportive 1.0. Readiness is the ratio of what you scored to the target and falls into three bands: 80%+ Star, 60-79% Core, below 60% Focus.
04How does it identify training needs, where does the list come from?
A need is the gap between the level assessed and the level the job title requires. On lock, the matching training is pulled from the catalogue. Every item is tracked in four states: Pending, Assigned, Completed, Excluded, and marking one Completed requires a certificate or evidence link.
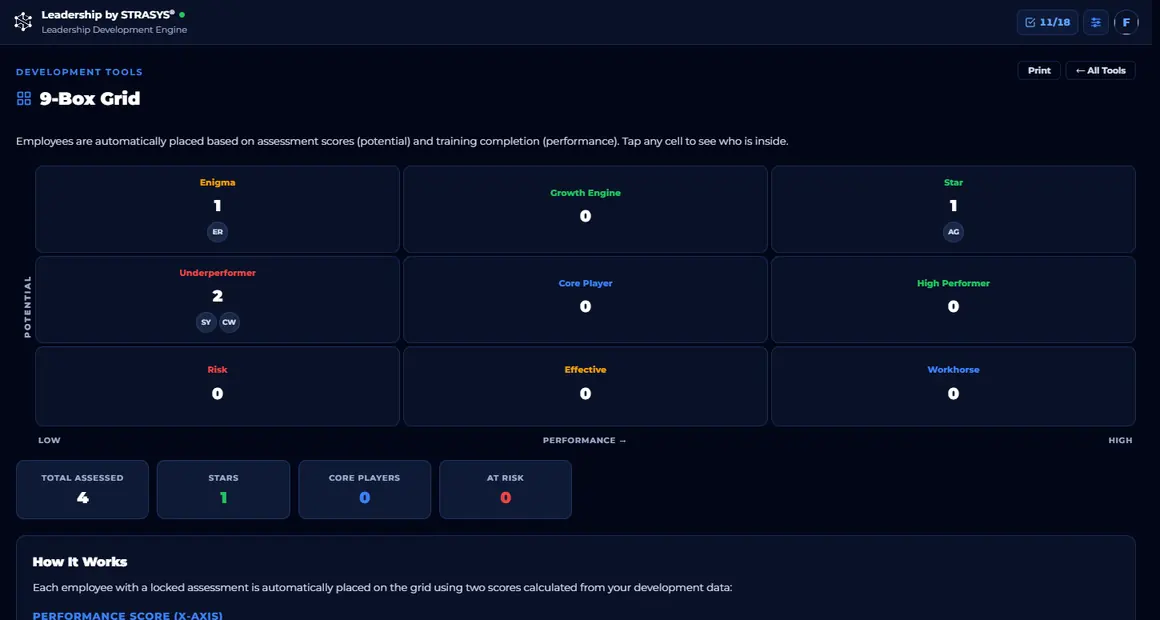
05How does it use the 9-box grid?
The performance axis is the share of completed training, the potential axis the weighted share of competency levels. On both axes 70%+ is the top band and 40%+ the middle, and the nine cells are named: Enigma, Growth, Star / Underperformer, Core Player, High Performer / Risk, Effective, Workhorse. Only locked employees enter the grid.
06What does this development cost?
The Training Investment tool totals the hours and cost of the generated plans; every catalogue item carries a provider, a duration and an amount. The same data is read by the Development ROI tool.
07Can I share a report with my team or my boss?
Yes, by link. The reader does not need an account, and the Export Center produces branded reports. The application itself is single-user; sharing happens only at the output level.
08How many people, how many job titles?
150 employees, 30 job titles, 25 competency slots and 12 tiers. Tier 1 is the C-suite, tier 12 entry level.
09Is there 360-degree feedback, does the team score too?
No. A single manager does the assessment: there is no self-assessment, peer review or multi-rater input. The application never emails or notifies the employee, the assessee or any third party.
10Price and data?
Subscription through Google Play, with a 30-day trial. Data sits on Google Cloud in europe-west1 with complete account isolation. The audit trail records 27 action types, and account deletion is inside the app.
Culture · Quality culture
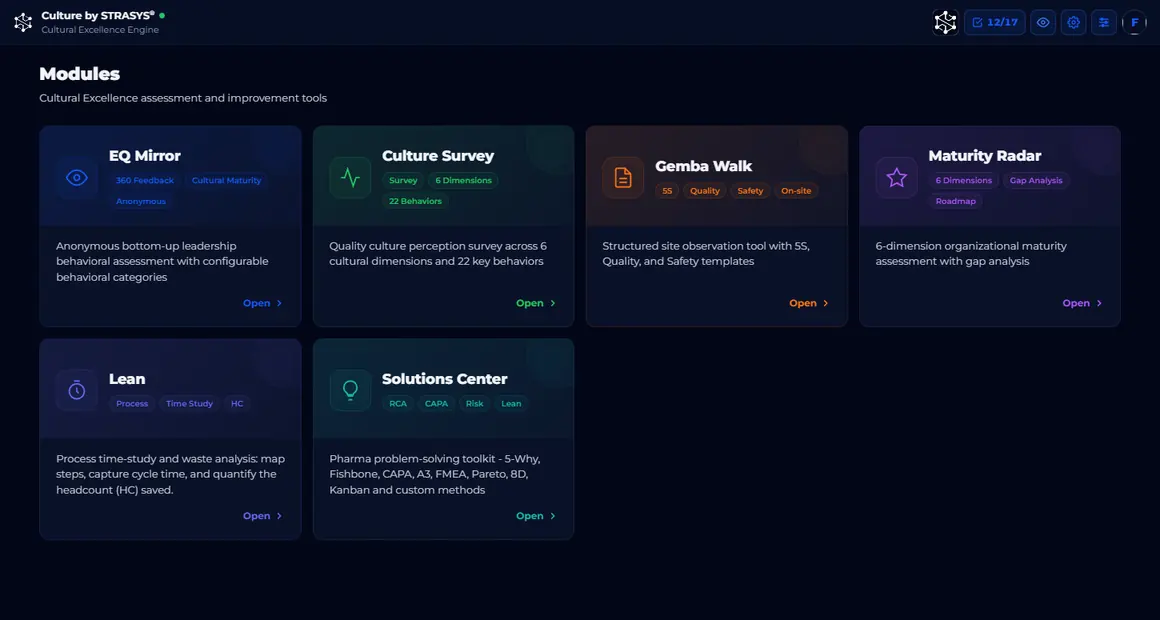
It measures quality culture with four separate engines: leadership behaviour, employee perception, floor observation and organisational maturity. All four roll into one culture score.
For regulated sectors that must measure quality culture in an audit-ready way.
Screens from the app
Frequently asked
01Are we meeting cultural excellence criteria, and how would I know?
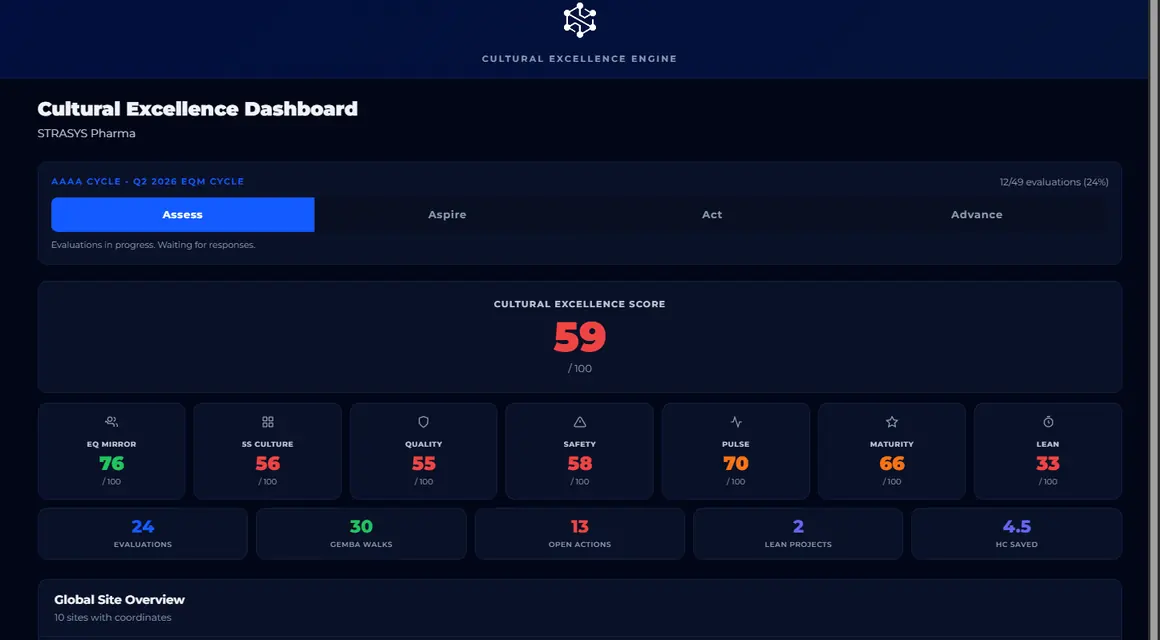
Data from six modules rolls into one composite score that falls into one of five bands: 90+ Exceptional, 80+ Excellent, 70+ Achieved, 60+ Keep Pushing, below 60 Action Needed. The score comes from seven dimensions and a dimension with no data does not enter the average at all, so missing measurement never inflates the result.
02Do our leaders actually own quality?
EQ Mirror has the team assess a leader's behaviour anonymously on a 1-5 scale, using categories you define. If a category falls below 70, a root-cause task opens server-side: the leader cannot close that assessment without choosing a cause and writing an action.
03We ran a survey and the report went on a shelf. How is this different?
Here a measurement is not an output, it is a trigger. Gemba findings, maturity gaps and survey results drop straight into the Action Center; every action card has subtasks, an owner and a completion approval. It does not close without evidence.
04If an auditor or a customer says "show me your quality culture", what do I have?
Every closed cycle is kept as an immutable snapshot, so quarters are genuinely comparable. Alongside it you have the audit trail, evidence-backed action closures and CSV export. No PDF report is generated; printing is the browser's own.
05How do you run a gemba walk, and with what checklist?
With three ready templates: 5S, Quality Mindset and Safety Culture. Each has five categories with two items per category, ten items per template. Items are rated 1-5, findings carry one of three severities, and categories can be added or removed.
06What does the perception survey measure?
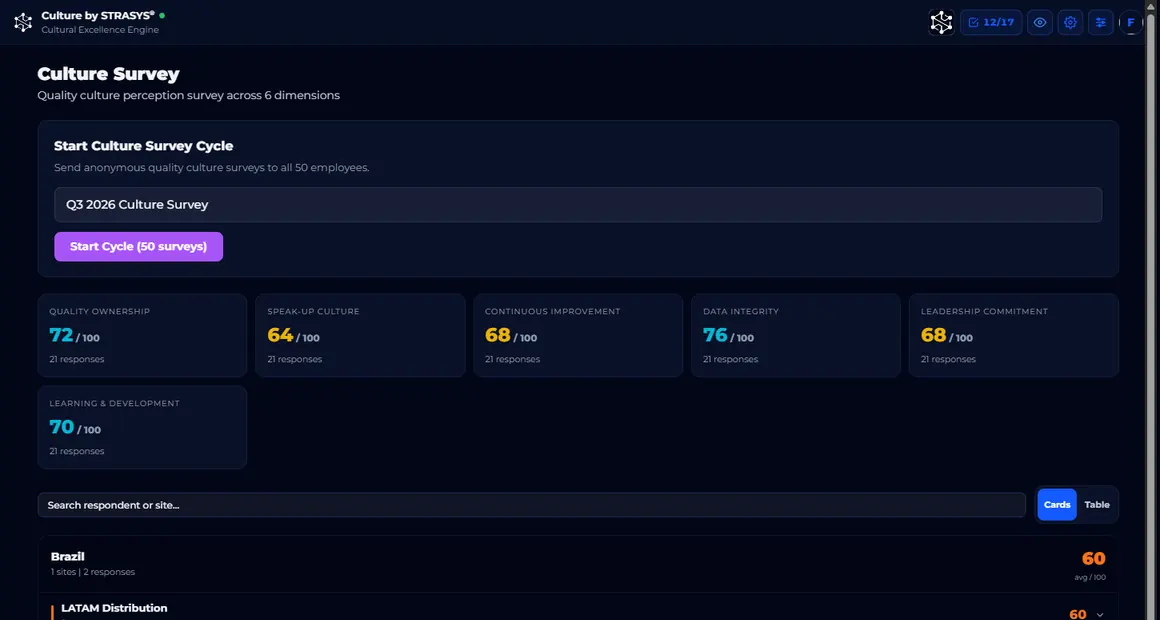
Six culture dimensions through 22 behavioural questions: quality ownership, speak-up culture, continuous improvement, data integrity, leadership commitment and learning. Participation is through an anonymous link and respondents never create an account.
07What is our maturity level, how far is the target?
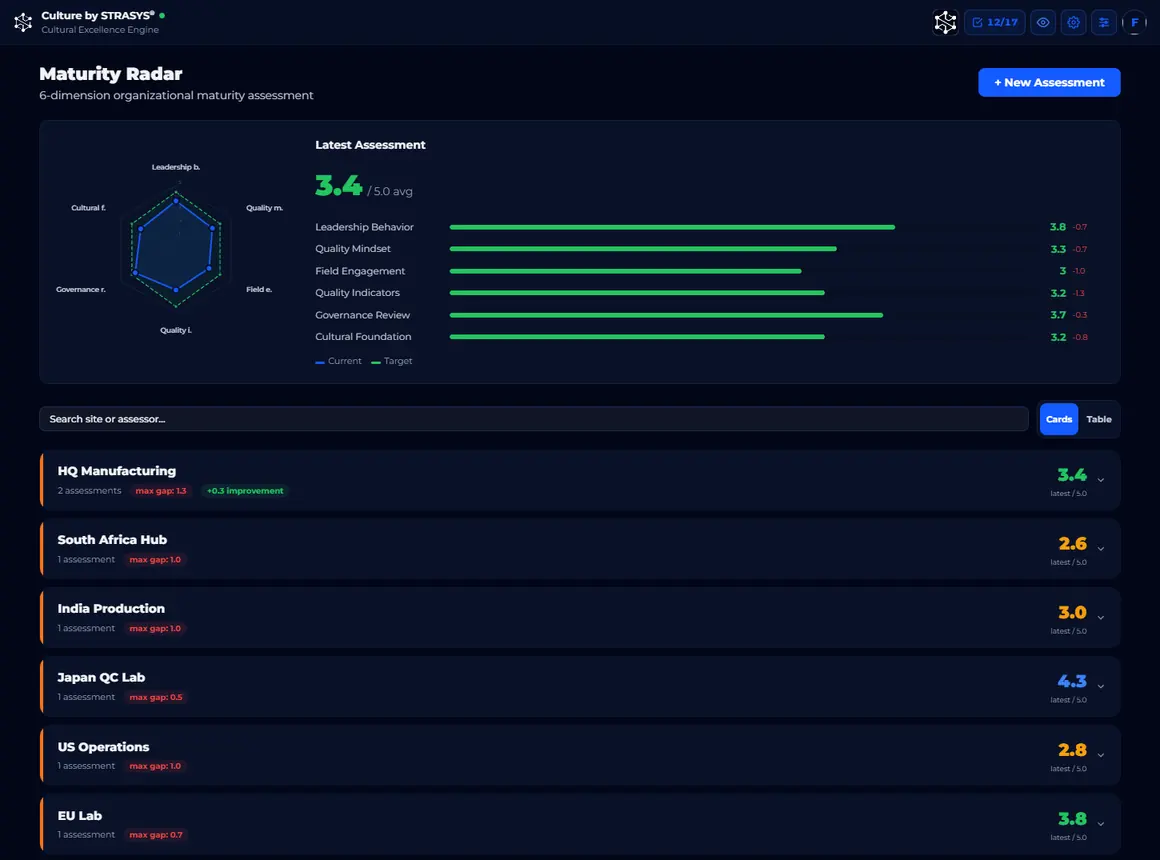
The Maturity Radar measures six dimensions on five levels and shows the gap between current and target. The gaps do not stay in a report; they drop into the Action Center.
08Can I measure culture change over time?
Yes. Assessment cycles open and close; a closed cycle is kept as an immutable snapshot, and a six-report analytics layer compares quarterly progress.
09Who sees what, how many sites?
A six-tier role model (CEO, C-Suite, EVP, VP, Director, Manager) is enforced in server-side rules. The product is multi-site: region, country and site breakdowns are standard, while a per-person composite performance score is deliberately absent.
10Price and data?
Four tiers, monthly only: 10 seats $49, 25 seats $99, 50 seats $179, 100 seats $299, with a 10-seat minimum. A 30-day trial with 5 seats during the trial. Data on Google Cloud in europe-west1.
Lean · Process and efficiency
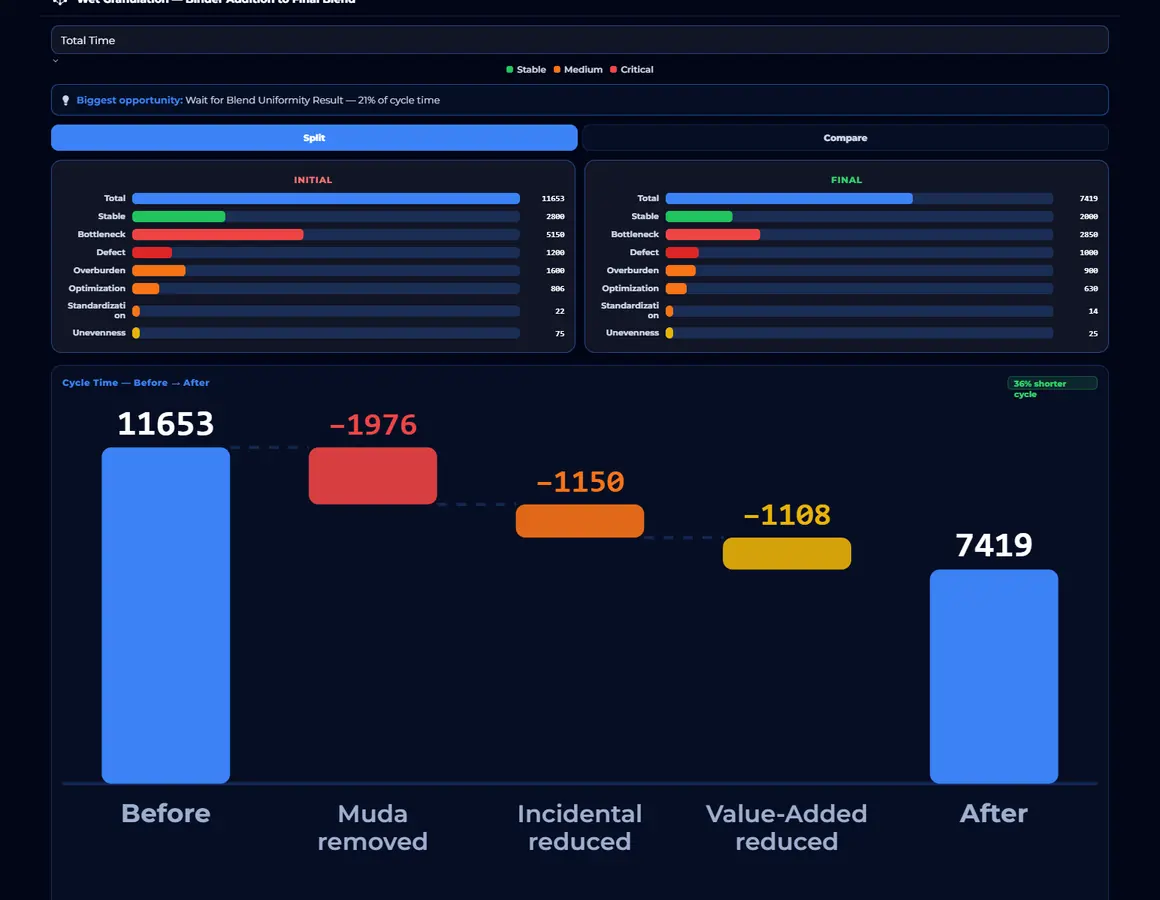
It maps a process step by step, separates non-value time and cost, and shows the improvement as a before and after. Where an organisation has gone blind to itself, the numbers speak.
For operations teams that want process improvement tied to numbers instead of opinion.
Screens from the app
Frequently asked
01Which processes and which companies is it for?
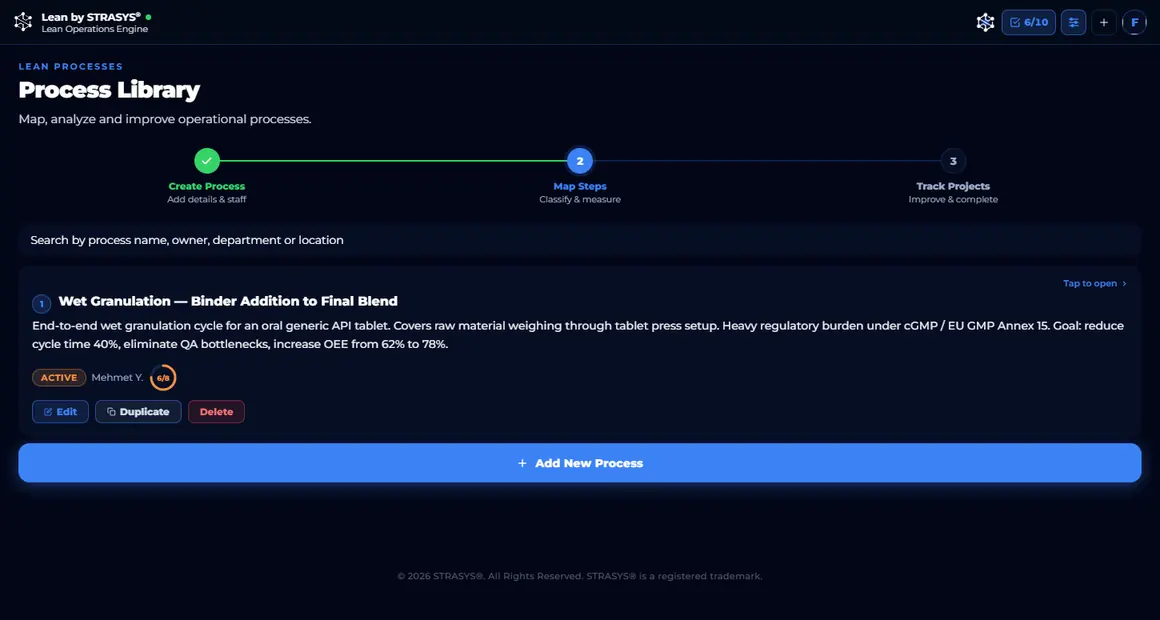
Any process you can measure: a production line, a laboratory, a warehouse, a call centre, an approval flow in the office. There is no industry restriction, because the unit of work is a process, not a sector. You define it with name, owner, department, location, headcount, shifts, breaks and demand; the rest comes from the steps.
02Operational blindness: we cannot see our own process. What changes?
You write the process out step by step and each step is labelled twice: Value-Added, Incidental or Waste, then one of seven characterisations — Stable, Bottleneck, Defect, Muri, Mura, Standardisation Issue, Process Optimisation. The step everyone justified with "this is how we do it" turns into seconds, metres and units, and the argument moves from opinion to data.
03What separates this from a consultant or a certification?
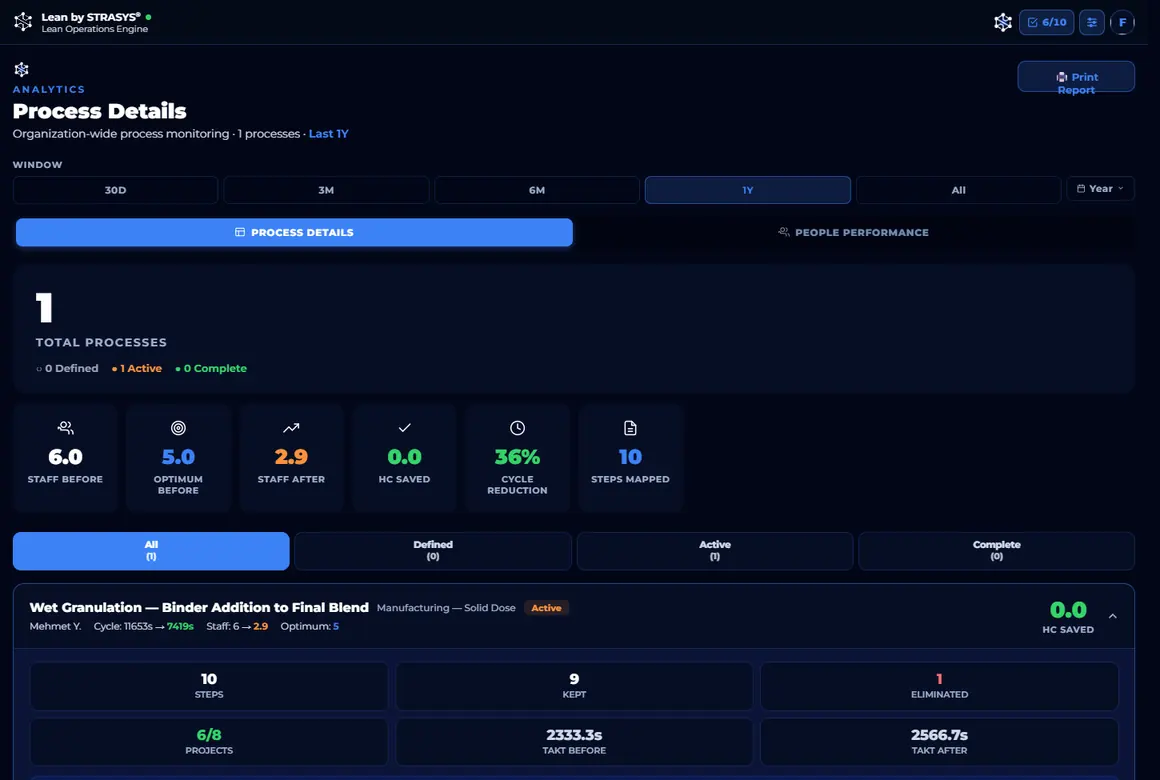
Three things. It was written for someone without Lean training; the calculations run server-side and cannot be edited by hand; and headcount savings appear only once every improvement project reaches 100%. The number never stays in a slide deck, and it does not show up before it is verified on the floor.
04Are cycle time and takt calculated automatically?
Yes. Once you enter shifts, working time, tea and meal breaks and planned downtime, cycle time, takt time, available time, staffing requirement and headcount saving are computed without a single formula.
05How do you run a time study?
Step by step, with the stopwatch. A start time is required for every step, and an end time too unless the step was eliminated. Distance, inventory and notes are optional, because not every process has a distance or a stock, and making them mandatory just makes people type fake zeros.
06Is the saving real, how is it verified?
A before/after scorecard compares six dimensions: total time, value-added time, incidental work, waste, distance travelled and inventory. Steps that are not stable generate improvement projects following DMAIC, and the saving does not enter the table until those projects close.
07Which Lean tools are inside?
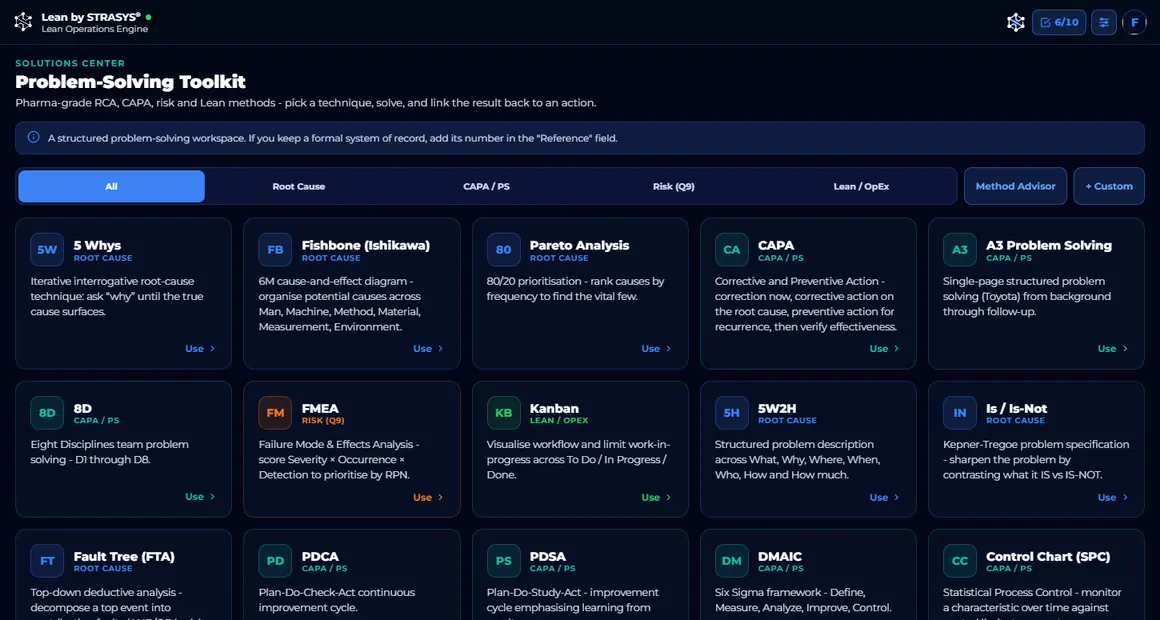
A documented library of 28 tools, six standalone calculators (Stopwatch, 7 Muda, OEE, 5 Whys, Takt, 5S Audit) and a Solutions Center with 24 methods: 6 root cause, 7 CAPA, 5 risk, 6 Lean. In FMEA and Risk Ranking the risk column is computed automatically.
08How do I get to the root cause of a problem?
From a step marked as waste, or from an improvement project, "find the root cause" opens the right method pre-filled; when you are done the result stays linked to the process. The Method Advisor is rule-based, uses no AI and works offline.
09Is it single-user, can a team use it?
Single user. There are no roles, teams, invites, assignment or co-editing, and no project planning, dependencies, critical path or Gantt either. The product measures the process; it does not run the work.
10Price and data?
either $7.99 a month or $61.99 a year (effectively $5.17 a month). There is no free tier; the 30-day trial is limited to one process. Purchase is Google Play only and data sits in europe-west1.
Tools · Daily executive tools
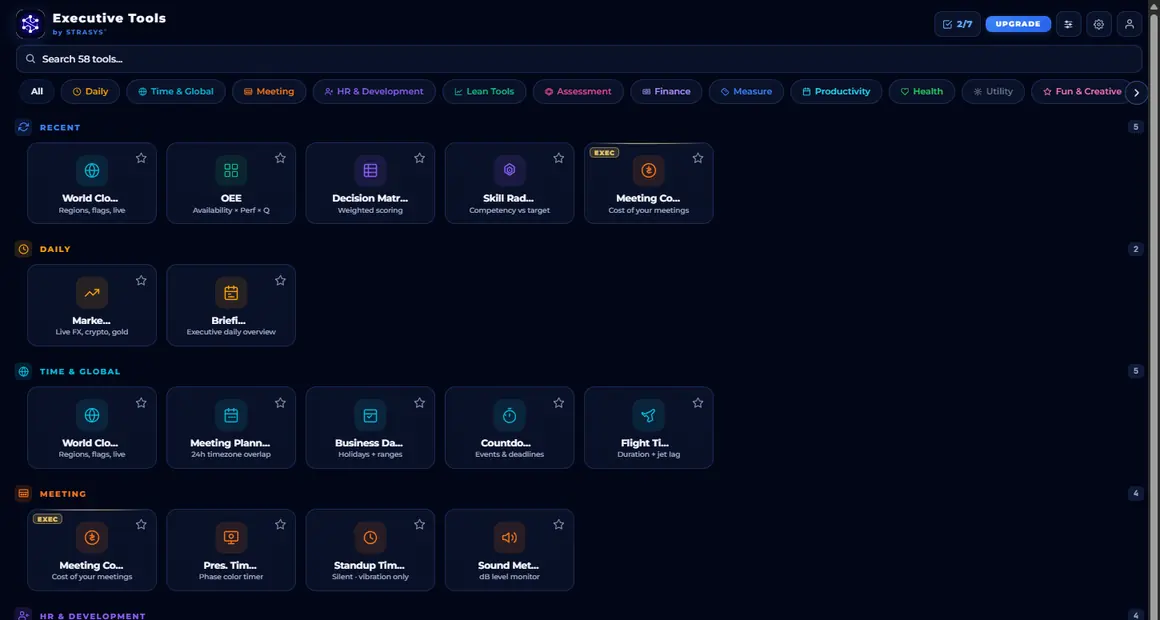
It gathers the 58 tools an executive needs during the day in one place: meeting cost, world clock, OEE, decision matrix, country risk. Every one of them works offline.
For any executive who needs a fast calculation or a decision aid during the day.
Screens from the app
Frequently asked
01What is unusual about this one?
All 58 tools are open on the free tier; the number of locked tools is zero. The $2.99 Executive subscription does not unlock a tool, it unlocks saving, history, export, premium themes and a few capacity limits. There are no ads and no third-party trackers, and tool data stays on the device.
02What are the 58 tools exactly?
Twelve categories: Daily 2, Time & Global 5, Meeting 4, HR & Development 4, Lean 6, Assessment 3, Finance 5, Measure 6, Productivity 6, Health 4, Utility 10, Fun & Creative 3. The catalogue is browsed with bilingual search, category filters, favourites and drag-to-reorder.
03What does a meeting actually cost the company?
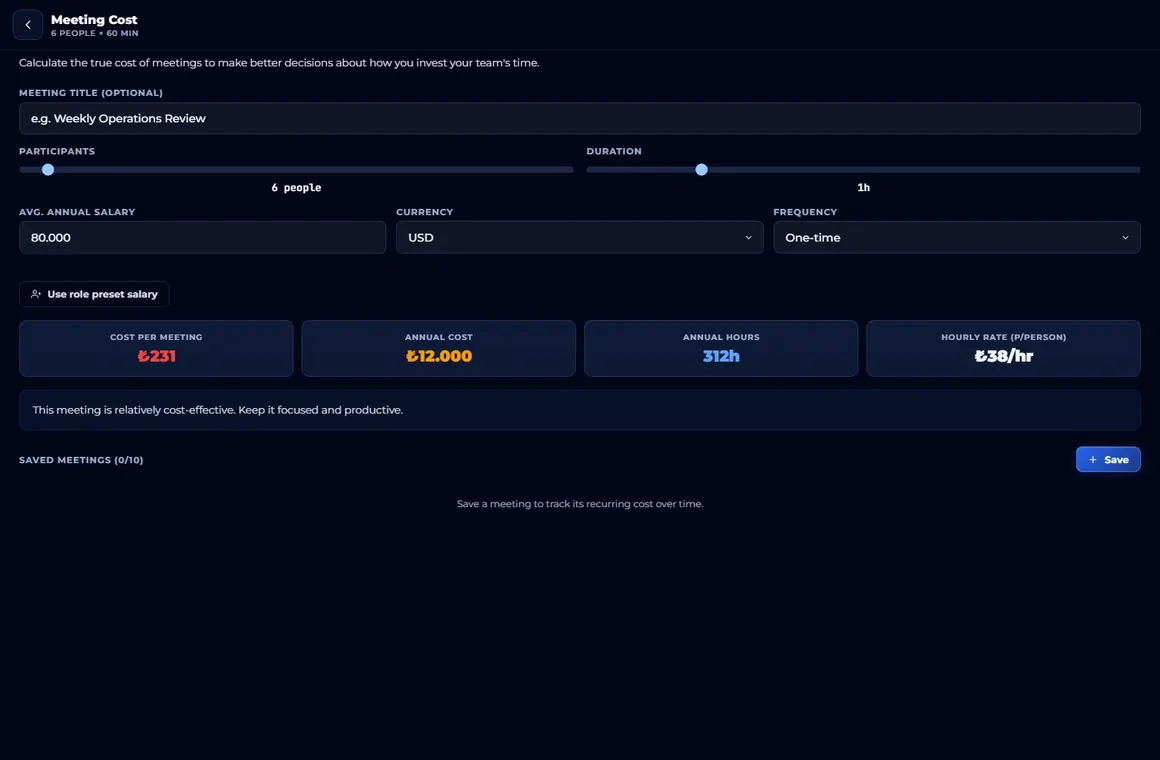
The Meeting Cost tool works out the real figure from the number of attendees, hourly cost and duration, so you can argue with a number instead of a feeling.
04Is there a teleprompter for talks and presentations?
Yes. You paste the text, set the speed and read from a phone or a laptop; no separate app or subscription is needed.
05How do I plan a meeting across time zones?
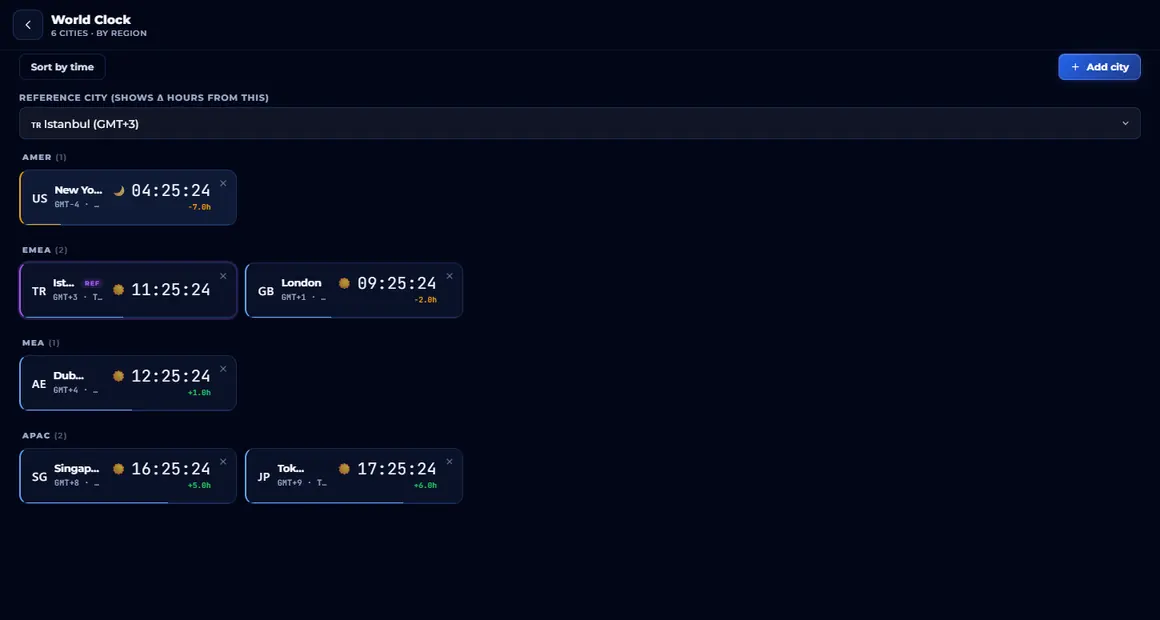
The Meeting Planner shows the 24-hour overlap, and the World Clock runs with regions, flags and live time. Coverage is 351 unique cities.
06Does it include the Lean calculations?
Six of them: OEE, takt time, 7 Muda, 5 Whys, a cycle timer and a 5S audit. The 5S audit is five categories by five questions, 25 in total; history keeps 3 records on the free tier and 30 on Executive.
07I have a choice to make, does it help?
The Decision Matrix compares options against weighted criteria and turns the result into a number. The same category also holds a SMART goal builder, a competency radar and a training ROI calculator.
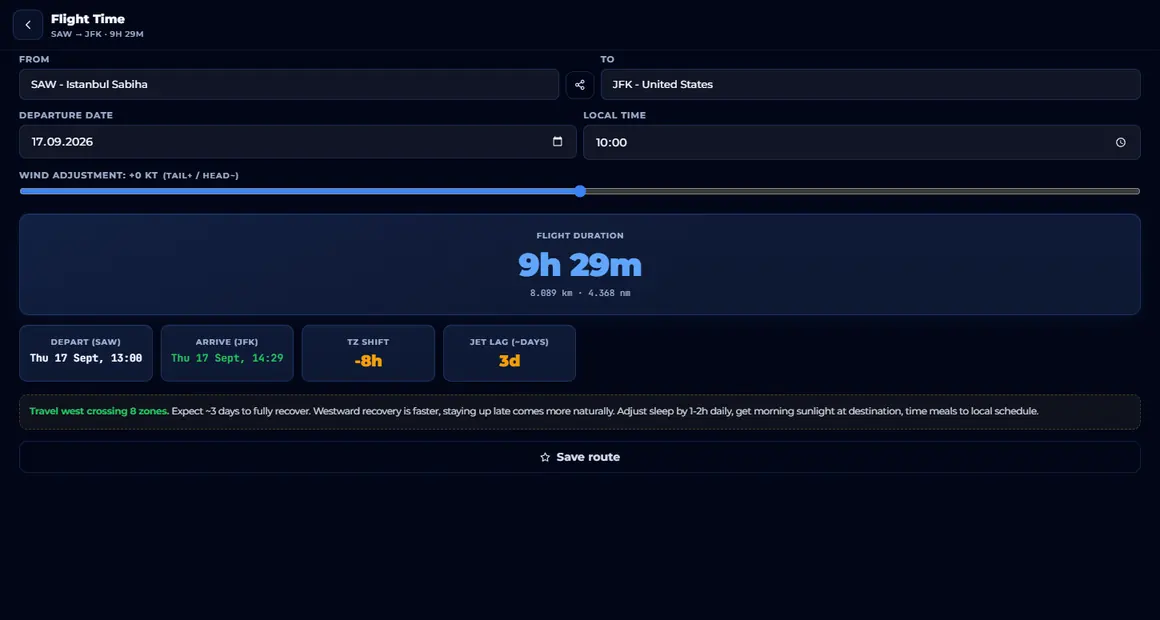
08What is there on the travel and country side?
197 country records: risk profiles, when to visit, visa checks and travel intelligence. On the free tier Country Risk covers all 197 countries; Executive extends visa and travel intelligence to 197 as well.
09It even has culture assessments?
Three: 5S Culture with 25 items, Quality Mindset with 20 and Safety Culture with 20, 65 items in total on a 1-5 scale with a five-band result. This does not replace the Culture app; it is a quick self-assessment.
10Price and data?
Executive is $2.99 a month or $22.99 a year (effectively $1.92). There is no trial, because the free tier is permanent and contains every tool. Tool data stays on the device; cross-device sync comes with Executive.
If you are not sure which app fits you, write to us and we will tell you in ten minutes.
Get in touch